Funnel
Last updated on November 19, 2015
Introduction
Funnel is a distributed monitoring system based on a lightweight streaming protocol. To get started, please read the most appropriate documentation:
- For engineers that want to instrument their code, see here
- For operations staff who want to aggregate metrics, monitor systems and familiarise themselves with the failure modes, see here
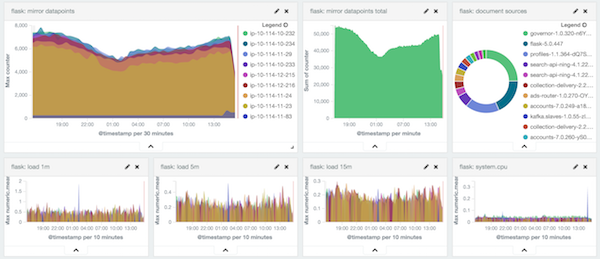
Funnel allows systems to push, pull, mirror, and aggregate metrics from disparate systems, all with a unified API. High-level dashboards can then be created by downstream consumers. Here is a screenshot of a Kibana dashboard visualising telemetry data collected by Funnel into ElasticSearch:
Design Overview
This section outlines some of the specific design choices in Funnel that make it different from other monitoring systems. Above all else, Funnel is a stream processor and all metrics are modeled as streams internally. At a high-level, the design can be split into four discrete parts:
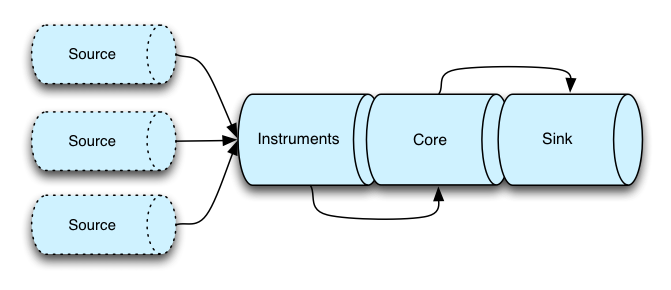
Each part of this pipeline has a distinct function:
Importers integrate Funnel with existing systems -- for example, systems that use StatsD. They translate third-party telemetry data into instruments that Funnel understands. If you're only using the native Funnel instruments in Scala, you do not need importers.
Instruments represent the kinds of metrics that are avalible in Funnel, as well as operations to update to those metrics. Each instrument funnels its updates to a number of streams in the Core.
Core is the primary part of the Funnel system. It's essentially a stateful container for all the telemetry data streams. The
Monitoringinstance allows for a range of operations on the streams, such as listing them, searching through them, subscribing and creating topics, etc.Exporters consume the streams in the core of Funnel and typically execute some kind of effectful transduction on those streams. For example, they might transform the streams into JSON and send them to ElasticSearch, or to a network socket. This part of Funnel is highly extensible, and you can create a new extension by simply providing a function of type
URI => Process[Task, Datapoint[Any]].
This is the view of the Funnel system from the perspective of a single machine, but this design composes accross the network to create a large distributed system. Viewed at a larger scale, the system can be visualized like this:
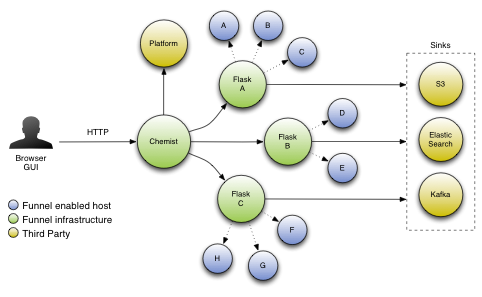
The specifics of this diagram are covered in the operatations guide section.
Several design choices were made specifically with the goal of giving Funnel the ability to scale linearly. The most obvious feature is that the relatioship between Agent and Flask is pull-based. By downsampling at the level of individual agents, the aggregating Flask systems never see load spikes that might cause cascading failures. The load on a Flask depends on the number of metric keys it has been asked to consume, and not on the volume of changes to the metrics under those keys. If the data rate on a given host increases, only the overhead on that host is affected since the downstream system pulls samples at a semi-fixed rate.
Time Periods
As with all monitoring systems, understanding the way time periods are handled is really important. A time period represents a time in which metrics are collected, and resets occur at the period boundaries. Funnel supports three different time window types, as illustrated by the diagram below:
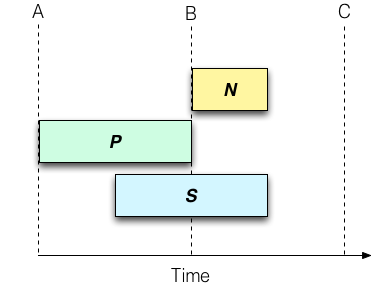
In this diagram, T represents time moving left to right. A, B and C illustrate time period boundaries. The duration of time periods is arbitrary, but the default setting in Funnel is 1 minute. In this frame:
- N - The "now" time window represents the current set of metrics that are in flight, and explicitly does not represent a completed period. If 30 seconds have elapsed in the current 1-minute period, then "now" only comprises the metrics collected in the past 30 seconds. Any new metric updates go into this window, and the window resets at each period boundary.
- P - The "previous" window represents the full minute prior to the last period boundary. Think of this as a stream that only updates its values once every full period duration.
- S - The "sliding" window represents a full period duration, irrespective of whether that duration crosses a period boundary. If a period is 1 minute, then the "sliding" window contains all metrics collected in the past minute. Any new updates go into this window, and are removed from the window when they are more than 1 period old.
Units
A given metric is denoted in specific Units. For example, the value 18544 for, say, memory usage would not be especially useful. Funnel will be explicit about whether that is 18544 bytes or 18544 megabytes. At the time of writing the library supports the following Units:
CountRatioTrafficLightHealthyLoadMillisecondsSecondsMinutesHoursMegabytesNone
This is not something that users generally will ever need to extend, but when using the gauge instrument you will need to specify the units for that gauge.